Spatial Analysis
Users of ArcGIS know that it has its origins in Python, and that many analyses can still be scripted in Python and run using the integrated development enviroment (IDLE, in ArcGIS parlance) that ships with every installation.
Several high quality spatial analysis packages exist for R, with excellent documentation both in the manual and through the Stack Exchange community. I am R-centric, so I think it may go as far as duplicating the functionality of ArcGIS -- but most operations are manually controlled, so more thought might be needed to do mundane operations like placing labels, and therefore more experience will translate into faster production.
Until I started using R for spatial analysis I did not know that there is a standard way to specify coordinate reference systems based on an obsolete working group, the European Petroleum Surveyor Group: the EPSG string. Also, the first time someone sent me an ESRI file geodatabase it took me about an hour to install the ESRI driver to read it. I understand this driver may now be native in Windows installations of GDAL, but it may still need manual installation in Linux (I'm a dedicated Ubuntu user). If you need to install it, start with the driver documentation at http://www.gdal.org/drv_filegdb.html.
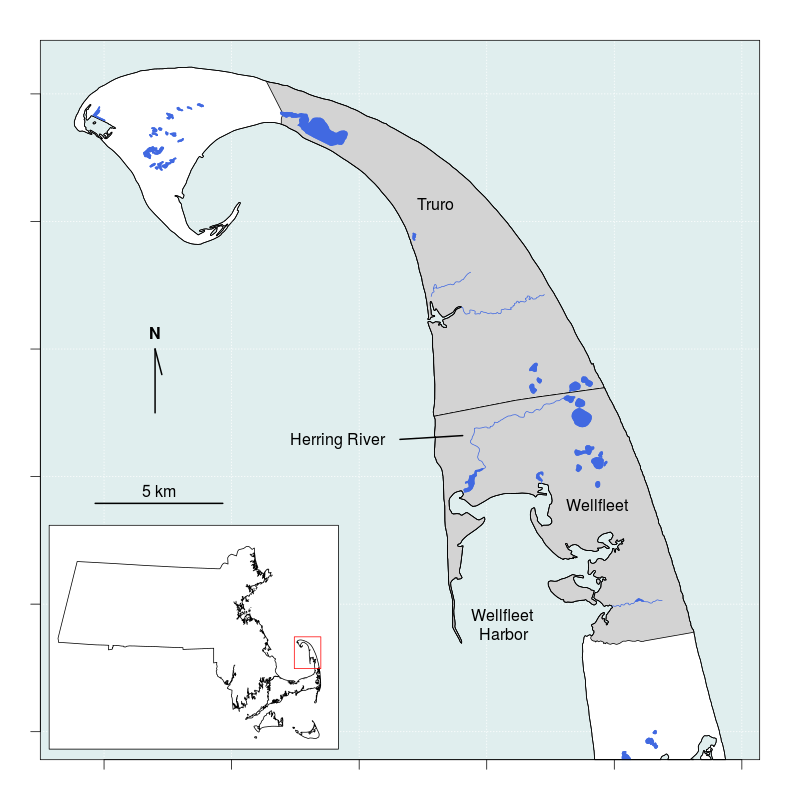
Creating the imagery is only a fraction of the work in spatial analysis. I recently made this simple map of a project area in R and I probably spent as much time sorting through and testing the possible features to include as I did creating the actual image, and there is no actual spatial analysis involved.
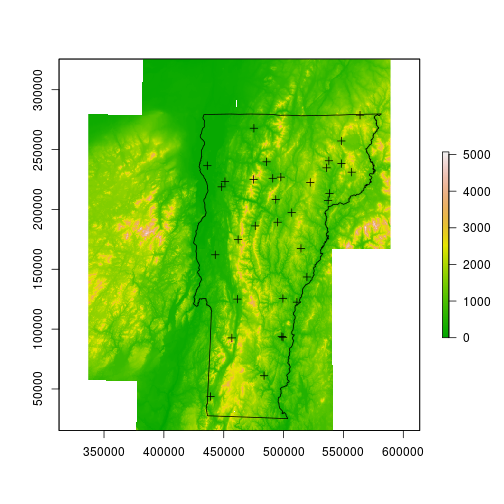
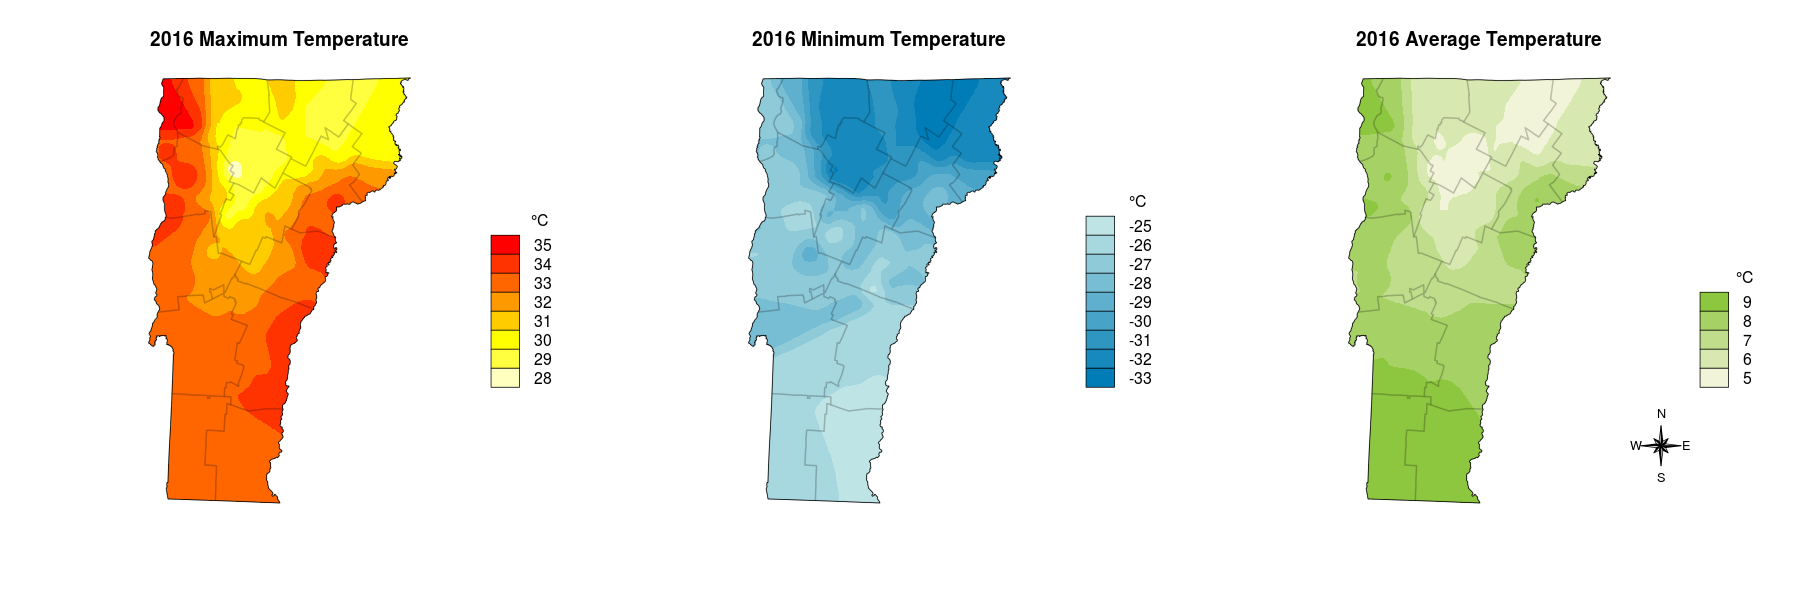
A huge advantage to working with spatial data in R, or Python, or in any scripting platform outside of ArcGIS, is that data are not typically ready to map without some pre-processing -- and the processing will usually be done in a scripting platform anyway. Here is a simple example: air temperature is measured at discrete points across the landscape, but everyone knows that the air between those points must also have a measureable temperature. To present air temperature data such as this we could avoid the issue by adopting a 1-dimensional approach, which is to place it in a table with a row for each weather station. That is boring to consume and fails to acknowledge that air is distributed across the landscape. To take a 2-dimensional approach we must interpolate between the points, which is where the scripting language comes in. Here is an example of a map that does exactly that for the state of Vermont. The first image shows the locations of the monitoring stations on the digital elevation model, the second is the interpolated temperature with isotherms rendered in a heatcolor gradient and with county lines added for reference. See a post on making this map.

Another advantage to working with spatial data in a scripting language rather than ArcGIS is that it is simple to batch-process multiple maps. Here are three similar maps created using the same script as the above map, but pointing it to new data for each iteration.
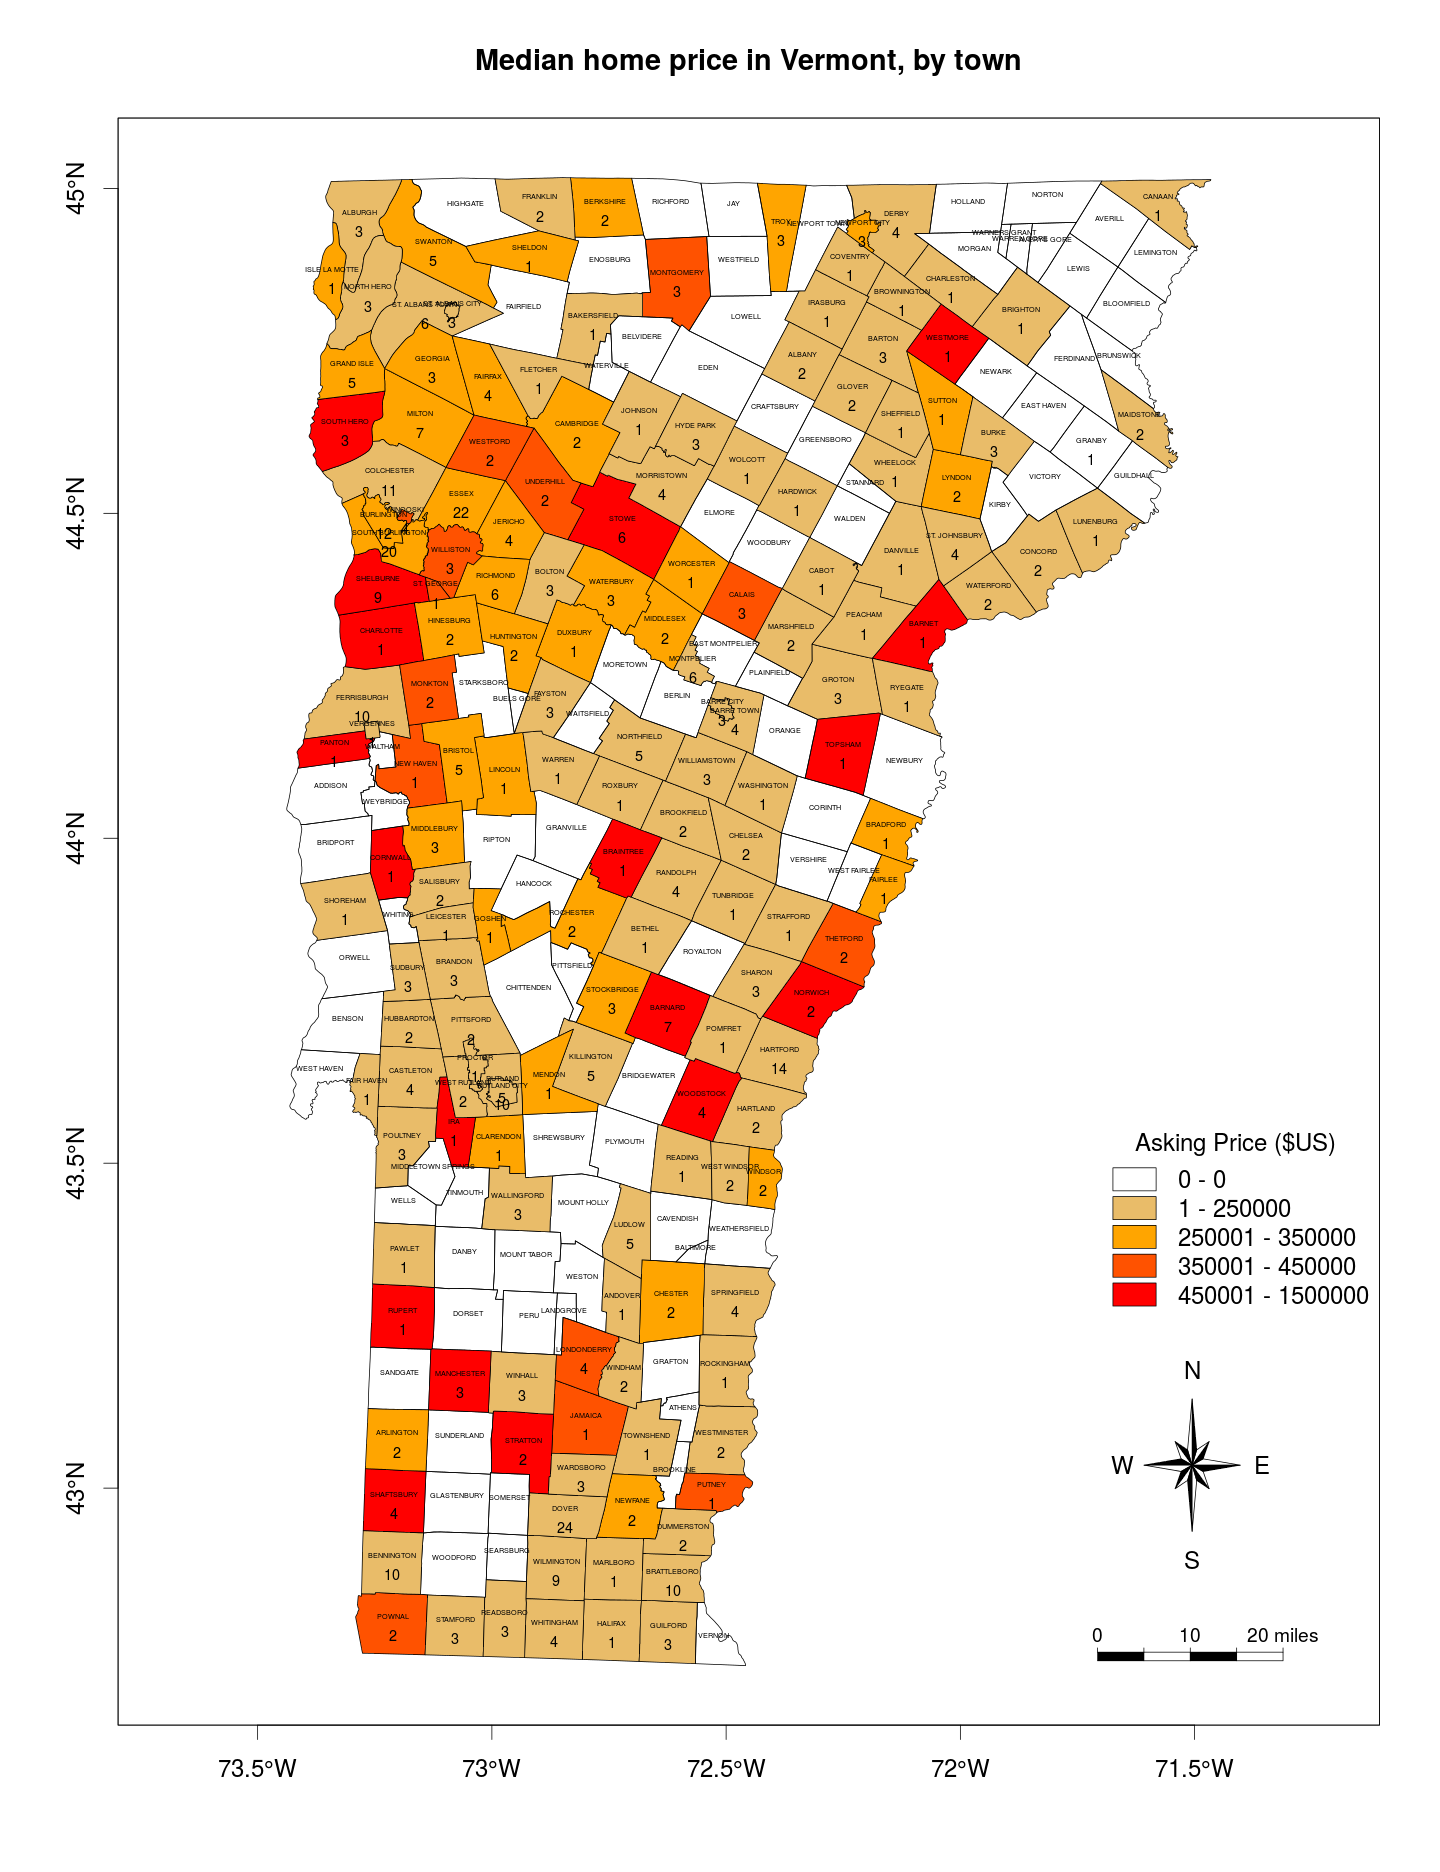
It is also possible to combine data collection and mapping processes as well as automate them to present up-to-date information. In some cases this can be done interactively in a dynamic server-side application, and in other cases it may be for a static report to convey a snapshot of time. That is the case with this map of 2015 home sale prices in Vermont, which were scraped from the web and mapped in a single script. When making this map I forgot to note that the numbers in the towns indicate how many homes were for sale at the time the data were grabbed. See a post on making this map.