I am making a quantitative survey application, and we need to elicit from experts a rate for an ongoing event for which models of future values do not exist - lets call it the accretion rate of a glacier - over a period of time. We assume that the rate is not constant (although it could be), so we need to be able to have experts define it in a dynamic environment. We also assume that the rate is predictable, so they can define it at all.
It would be easy to show a graph of the rate on the screen, choose a distribution to model it, and offer a slider or two with parameters that allow experts to shape the graph. Unfortunately, the rate-over-time is completely unknown. It may be static (no slope), linear (with positive or negative slope), parabolic, logarithmic, normal, sinusoidal, assymetrical, stepped… in other words it can be any shape, and I don’t want to bias or confine the results by pre-selecting a distribution or having each expert pre-select a distribution from a set of images. Instead I will allow experts to draw any rate they like on screen, and I’ll derive point estimates at each year from their drawing.
I’ve never done this, but fortunately, William Malone has code for making a drawing canvas on his blog, so I’m going to modify his code to create a canvas with graph paper behind it.
My goals for this are:
- Allow multiple canvas elements in a single app
- Show regular gridlines on the canvas to make it look like a graph
- Pass x/y values to the server when the user updates the drawing
- Package the code so that I can load it quickly, reuse it, and share it
The easiest way to allow multiple canvas elements in a single app is to generate uniquely named global js variables using a script-generating function within R, then I only need to call that function after initializing the parent div. It is probably not the most elegant way, but it is fairly quick and I can clean it up in the future.
To apply regular, user-configurable gridlines that provide experts a frame of reference to orient themselves on the canvas I can use css background gradients in both directions.
The shiny input binding that will send the x and y values to R, or populate the x and y values from R, will send a callback on the mouseup and mouseleave properties which presumably won’t update more than once per second.
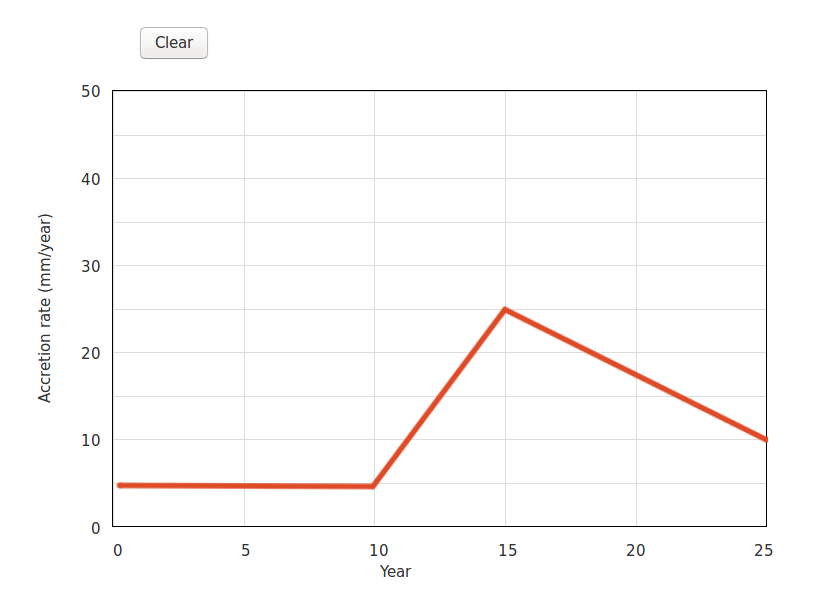
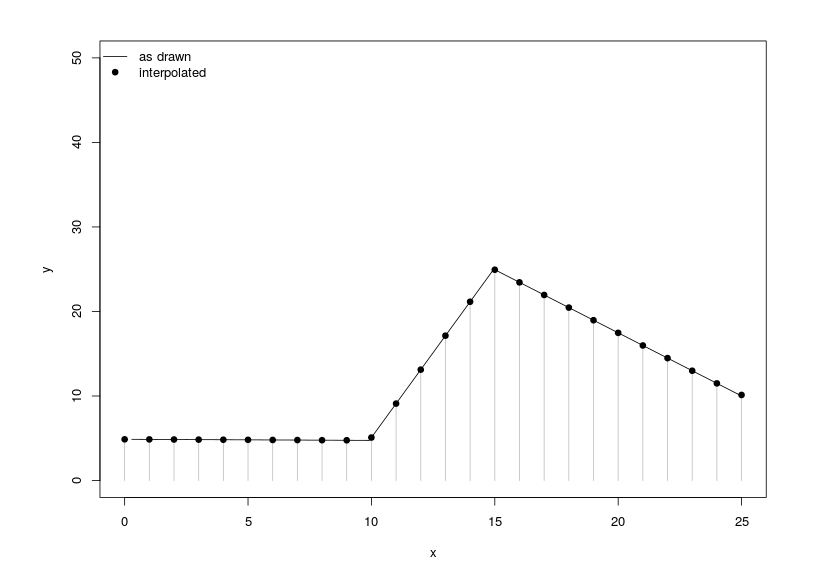
Here is the result of four clicks on the canvas, followed by a rendering of how the server will interpret the values:
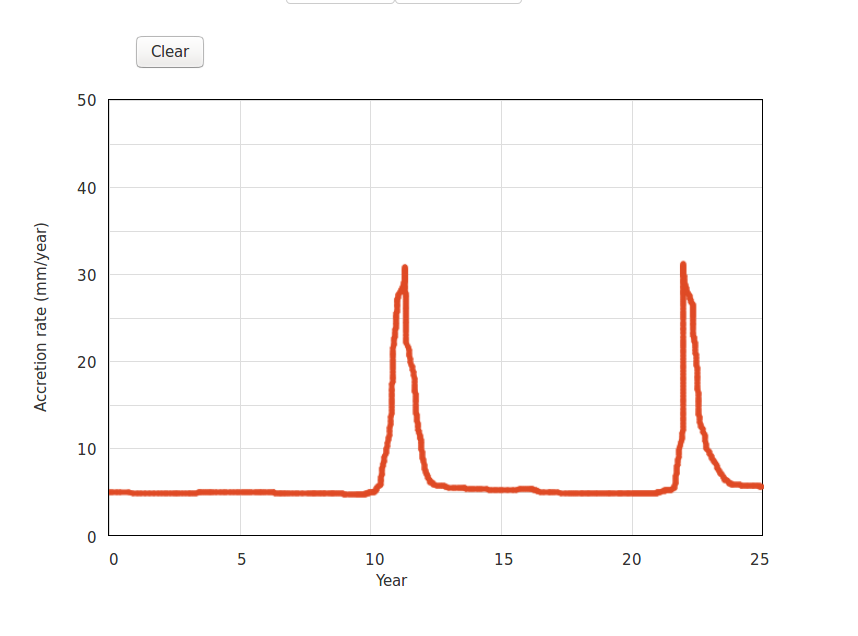
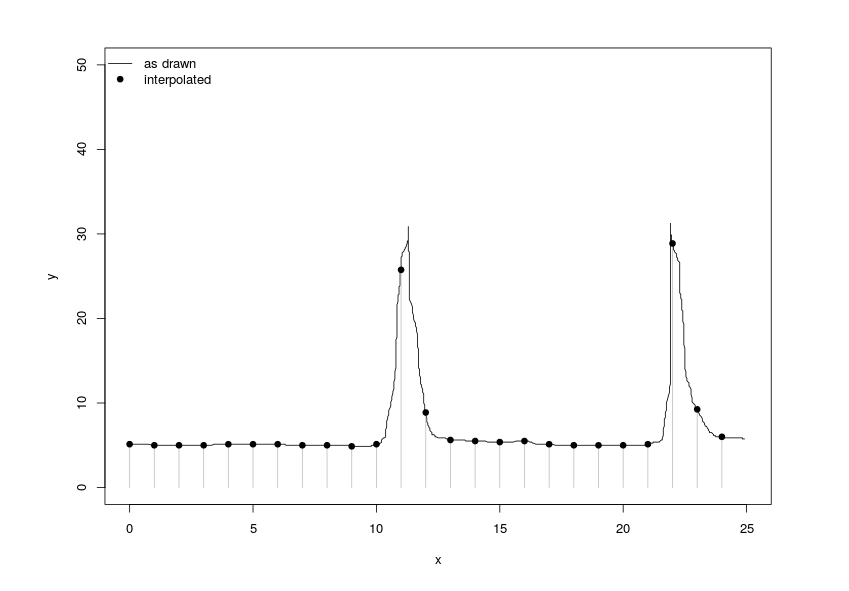
If an expert wants to illustrate something like el nino dependency, they could click and drag to produce an 11 year spike:
To test this input (along with a set of jQuery sliders for collecting 4-point elicitation values), install the package from github and run the example app:
devtools::install_github('jonkatz2/enquery')
library(enquery)
sliders()